
Professional Report Graphs and Charts Designed in Adobe Illustrator
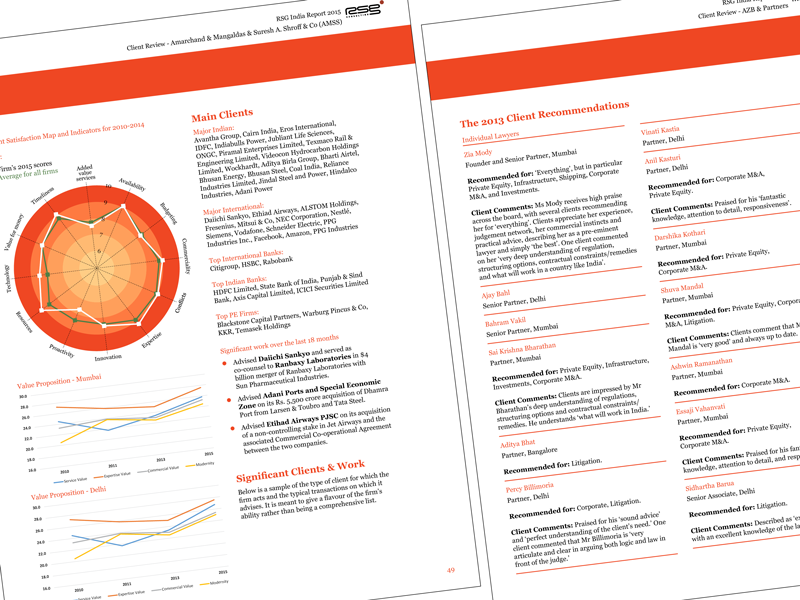
Sarahjane creates professional graphs and charts in Adobe Illustrator, including spider graphs, radar charts, bar charts, and other data visualisations, before importing them into Adobe InDesign report layouts. Using supplied data, she carefully matches colours, typography, and styling to your brand, ensuring every chart integrates seamlessly with the overall document design.
For a 240-page legal report, Sarahjane produced more than 40 bespoke graphs alongside numerous tables and supporting graphics. Once the first graph was approved, she efficiently created the remaining charts, maintaining complete consistency throughout the report and helping the project stay on schedule.
Every graph is designed to fit the available page space while presenting complex data in a clear, accurate, and visually engaging way. Working closely with consultants and project teams, Sarahjane ensures all charts are easy to understand, brand compliant, and ready for both print and digital publication.
Visit Sarahjane’s testimonials page to read reviews from clients and design agencies, and discover why she’s trusted to deliver accurate, high-quality artwork on time and to the highest standard.

